XRP’s Golden Cross: Bitcoin Price Impact Analysis
The cryptocurrency market has long been characterized by interconnected movements and technical patterns that influence multiple assets simultaneously. One such pattern—the golden cross—has gained significant attention in recent years, particularly when it appears in major altcoins like XRP. A golden cross occurs when a shorter-term moving average crosses above a longer-term moving average, traditionally signaling bullish momentum. When XRP exhibits this pattern, market participants often scrutinize potential ripple effects on Bitcoin and the broader crypto ecosystem.
Understanding the relationship between XRP’s golden cross and Bitcoin’s price movements requires a comprehensive analysis of technical indicators, market correlations, and the fundamental drivers of both assets. This examination explores how altcoin technical patterns can influence market sentiment and whether XRP’s golden cross genuinely impacts Bitcoin’s trajectory or merely reflects broader market cycles.
Understanding the Golden Cross in Cryptocurrency Markets
The golden cross is a technical analysis pattern that has been employed by traders and investors across traditional financial markets for decades. In the context of cryptocurrency, this pattern carries particular significance due to the 24/7 nature of digital asset trading and the rapid information dissemination across global markets.
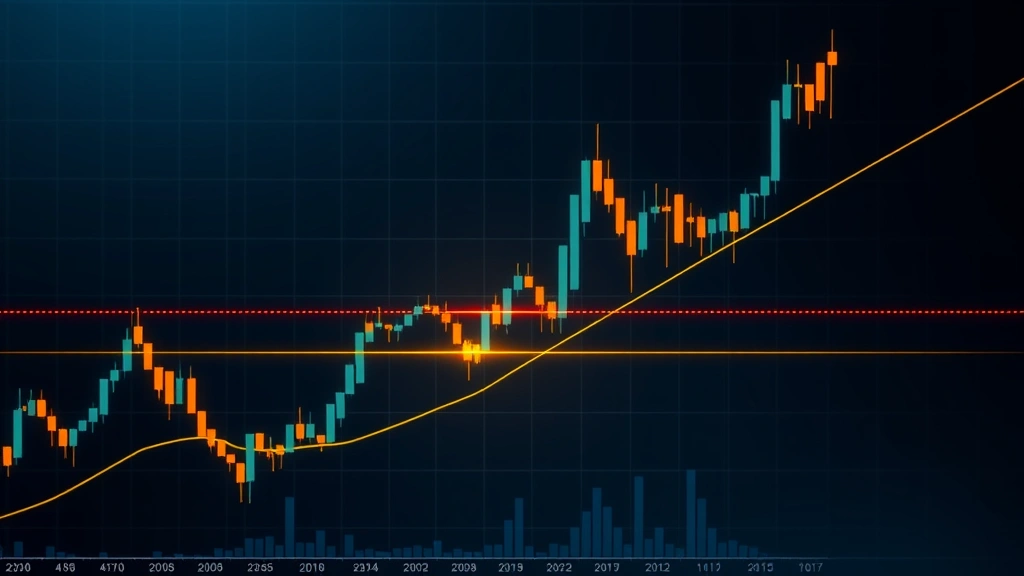
A golden cross typically involves the 50-day moving average crossing above the 200-day moving average. This convergence is interpreted as a shift from bearish to bullish momentum, suggesting that recent price action is outpacing longer-term trends. For XRP specifically, traders monitor these crossovers as potential entry points for bullish positions.
The mechanics of this pattern in cryptocurrency differ slightly from traditional markets. Crypto assets experience higher volatility, which can produce false signals more frequently. Additionally, the lack of market closure means golden crosses can form at any hour, potentially catching traders across different time zones. The psychological impact of a golden cross should not be underestimated—when widely recognized technical patterns form, they often become self-fulfilling prophecies as traders act on the signal simultaneously.
External resources like CoinDesk frequently analyze these technical patterns, providing institutional-grade analysis that influences retail and professional traders alike. Understanding these patterns requires knowledge of Bitcoin’s price behavior and how altcoins interact with the market leader.
XRP’s Technical Position and Moving Averages
XRP has demonstrated unique technical characteristics that distinguish it from other major altcoins. As the native token of the Ripple protocol, XRP has maintained substantial market capitalization and trading volume, making its technical signals relevant to broader market analysis. When examining XRP’s moving averages, traders look at both the 50-day and 200-day metrics, along with shorter-term indicators like the 20-day moving average.
The formation of a golden cross in XRP’s price chart typically precedes significant price movements. Historical data shows that when XRP’s 50-day moving average crosses above its 200-day moving average, volatility often increases substantially. This increased volatility can ripple through the market, affecting correlated assets including Bitcoin.
Several factors influence whether XRP’s golden cross becomes a reliable predictor:
- Volume confirmation: Golden crosses accompanied by above-average trading volume tend to be more reliable signals than those occurring during low-volume periods.
- Market cycle phase: The effectiveness of golden crosses varies depending on whether markets are in early bull runs, mature bull markets, or bear cycles.
- Macroeconomic conditions: Broader economic factors, regulatory developments, and institutional adoption news can override technical signals.
- Resistance and support levels: The proximity of the golden cross to significant price levels determines its likely impact on future price action.
XRP’s relationship with technical indicators is complicated by its regulatory status and the ongoing SEC lawsuit, which created unique price dynamics not present in other major cryptocurrencies. When analyzing XRP’s moving averages, traders must account for these fundamental factors alongside pure technical analysis.

Historical Correlation Between XRP and Bitcoin
The correlation between XRP and Bitcoin has evolved significantly over different market cycles. During the 2017 bull market, XRP exhibited strong positive correlation with Bitcoin, suggesting that Bitcoin’s price movements heavily influenced altcoin valuations. However, this correlation has weakened during certain periods, particularly when altcoin-specific news or regulatory developments dominated market narratives.
Analyzing historical data reveals several important patterns:
- Strong bull market correlation: When Bitcoin enters aggressive bull phases, XRP typically follows with correlated upward movements. Golden crosses in XRP during these periods often coincide with Bitcoin testing new resistance levels.
- Divergence during altseason: Periods of “altseason,” when altcoins outperform Bitcoin, show reduced or negative correlation. XRP’s golden cross during these phases may not significantly impact Bitcoin’s price.
- Bear market synchronization: During market downturns, correlation typically increases as both assets decline together, regardless of technical patterns in individual assets.
- Regulatory event sensitivity: XRP-specific news can create temporary decoupling from Bitcoin, overriding technical patterns.
Research from Blockchain.com provides detailed correlation metrics between major cryptocurrencies. Understanding these historical relationships helps traders assess whether XRP’s golden cross is likely to influence Bitcoin or whether other factors dominate price discovery.
The causality question remains important: does XRP’s golden cross cause Bitcoin price movements, or do both assets respond to common market drivers? Evidence suggests the latter explanation is more accurate, though XRP’s golden cross can serve as a confirming signal for broader bullish sentiment.
Market Sentiment and Investor Behavior
Technical patterns like golden crosses significantly influence trader psychology and behavior. When XRP’s golden cross forms, multiple trading platforms highlight this signal, creating awareness among thousands of traders simultaneously. This collective recognition can drive buying pressure independent of fundamental factors.
The impact on market sentiment operates through several mechanisms:
Retail trader response: Retail investors heavily rely on technical analysis and visible patterns. A golden cross in XRP often triggers buying interest from this segment, potentially increasing trading volume and price volatility across the market.
Algorithmic trading: Many trading algorithms incorporate moving average crossovers as entry signals. When XRP’s golden cross forms, automated systems may execute large buy orders, creating price momentum.
Media amplification: Crypto media outlets frequently report on golden crosses and other technical formations. This coverage increases retail awareness and can create self-fulfilling prophecies as traders act on widespread information.
Institutional positioning: Professional traders and institutional investors may adjust their Bitcoin positions based on XRP’s technical signals, viewing the altcoin as a leading indicator for broader market sentiment.
When learning about how to invest in cryptocurrency, understanding these sentiment dynamics becomes crucial. Investors should recognize that technical patterns influence market behavior, but they should not replace fundamental analysis in investment decisions.
The relationship between sentiment and price is bidirectional—golden crosses can create bullish sentiment, which drives prices higher, but also rising prices can create the conditions for golden crosses to form. Distinguishing cause from effect requires careful analysis of timing and market conditions.
Risk Factors and Market Volatility
While golden crosses represent bullish signals, numerous risk factors can override these technical patterns. Cryptocurrency markets remain highly volatile and susceptible to rapid reversals, particularly when technical signals clash with fundamental developments.
Regulatory risks: XRP’s ongoing regulatory challenges create uncertainty that can dominate technical signals. Adverse regulatory news can trigger sharp declines regardless of golden cross formations.
False signals: Golden crosses occasionally produce false breakouts, particularly in crypto markets with lower liquidity than traditional exchanges. Traders following these signals without additional confirmation can experience rapid losses.
Market manipulation: The relatively smaller market capitalization of XRP compared to Bitcoin makes it more susceptible to manipulation by large holders. Technical patterns can be artificially created through coordinated trading.
Macroeconomic shocks: Unexpected economic developments, policy changes, or geopolitical events can override technical patterns instantaneously. The COVID-19 pandemic and subsequent inflation concerns demonstrated how external shocks supersede technical analysis.
Understanding asset allocation principles helps investors manage these risks. Rather than relying solely on technical patterns, diversified portfolios can weather volatility from individual assets or sectors.
The volatility inherent in cryptocurrency markets means that golden crosses should be viewed as one tool among many, rather than definitive predictive signals. Risk management through position sizing, stop-loss orders, and portfolio diversification remains essential regardless of technical formations.

Future Outlook and Trading Implications
Looking forward, XRP’s golden cross formations will likely continue to influence market sentiment and potentially affect Bitcoin’s price through correlation effects. However, the crypto market continues to mature, with institutional adoption reducing pure technical trading’s dominance.
Several developments may reshape how golden crosses impact future price action:
Institutional adoption: As institutional investors comprise a larger share of crypto trading volume, fundamental analysis and long-term thesis become more important relative to technical patterns. Golden crosses may lose some predictive power as institutions focus less on short-term technical signals.
Regulatory clarity: If XRP’s regulatory status clarifies favorably, the asset may decouple from technical patterns as fundamental factors drive valuations. Conversely, adverse regulatory outcomes would override technical bullish signals.
Market efficiency: As the crypto market matures, inefficiencies that create reliable technical patterns may diminish. Golden crosses might become less predictive as market participants increasingly anticipate and price in technical signals.
Alternative metrics: Traders increasingly supplement moving averages with on-chain metrics, derivatives positioning, and other advanced indicators. These factors may prove more predictive than traditional technical analysis alone.
For traders and investors, the practical implication is that XRP’s golden cross should be considered alongside other analysis. Understanding different investment vehicles and strategies helps traders determine which technical patterns suit their specific approach.
Bitcoin’s response to XRP’s golden cross will likely remain correlated but not deterministic. The assets will continue to move together during broad market cycles, but XRP-specific developments will create divergence. Traders should monitor both assets independently while recognizing their interconnectedness.
Resources like the SEC’s official website provide regulatory updates that can override technical signals instantaneously. Staying informed about regulatory developments remains crucial for XRP investors and traders monitoring golden cross formations.
For those seeking deeper market analysis, Glassnode offers sophisticated on-chain metrics that provide additional context beyond traditional moving averages. Combining on-chain analysis with technical patterns creates a more comprehensive trading framework.
FAQ
What exactly is a golden cross in cryptocurrency?
A golden cross occurs when a shorter-term moving average (typically 50-day) crosses above a longer-term moving average (typically 200-day). In cryptocurrency markets, this pattern is interpreted as a bullish signal suggesting the beginning of an uptrend. Traders view golden crosses as potential entry points for long positions, though the signal can produce false breakouts in volatile crypto markets.
Does XRP’s golden cross directly cause Bitcoin price increases?
XRP’s golden cross does not directly cause Bitcoin price increases, but it can influence Bitcoin’s price indirectly through sentiment effects and correlated trading. When XRP’s golden cross forms, it may create bullish sentiment affecting broader market psychology, potentially encouraging Bitcoin buying. However, both assets typically respond to common market drivers rather than one causing the other’s movement.
How reliable are golden crosses for predicting cryptocurrency prices?
Golden crosses are moderately reliable in traditional markets but less reliable in cryptocurrency due to higher volatility and lower liquidity. In crypto, golden crosses should be confirmed with volume analysis, support/resistance levels, and fundamental factors. Relying solely on golden crosses for trading decisions carries significant risk and can result in losses from false signals.
Can I use XRP’s technical patterns to trade Bitcoin?
You can use XRP’s technical patterns as one signal among many when trading Bitcoin, but this approach has limitations. The correlation between XRP and Bitcoin varies across market cycles, and Bitcoin often moves independently of altcoin technical patterns. A more reliable approach combines analysis of Bitcoin’s own technical indicators with broader market sentiment assessment.
How do regulatory developments affect XRP’s golden cross signals?
Regulatory developments can override XRP’s golden cross signals entirely. Adverse regulatory news can trigger sharp price declines regardless of bullish technical formations. Conversely, positive regulatory developments can drive price increases independent of technical patterns. XRP investors must monitor regulatory developments closely as these factors can dominate technical analysis.
What timeframes should I use to identify XRP’s golden cross?
The traditional 50-day/200-day golden cross applies to longer-term analysis suitable for swing traders and position traders. Day traders might use shorter timeframes like 10-day/30-day crossovers, though these generate more false signals. The appropriate timeframe depends on your trading horizon and risk tolerance. Longer timeframes generally produce more reliable signals.
Should I invest based solely on XRP’s golden cross?
Absolutely not. Investing based solely on technical patterns is extremely risky. A comprehensive investment approach should include fundamental analysis, risk management, portfolio diversification, and understanding your personal investment goals. Technical patterns like golden crosses should supplement, not replace, thorough due diligence and fundamental research.


