Bitcoin Liquidation Map: Insider Insights
Understanding the bitcoin liquidation map has become essential for traders navigating volatile cryptocurrency markets. A liquidation map visualizes price levels where traders holding leveraged positions face forced exits, creating critical support and resistance zones. These maps reveal where concentrated liquidity exists and where sudden price movements could trigger cascading liquidations, fundamentally shaping market dynamics.
The bitcoin liquidation landscape continues evolving as more traders use leverage and derivatives. By analyzing where liquidations cluster, participants gain actionable intelligence about potential price support, resistance, and volatility hotspots. This insider knowledge helps traders anticipate market movements and position accordingly before major price swings occur.
Understanding Bitcoin Liquidation Maps
A bitcoin liquidation map is a sophisticated visual tool displaying where concentrated liquidation orders cluster at specific price levels. When traders use leverage—borrowing funds to amplify position size—brokers and exchanges require maintenance margins to protect against catastrophic losses. When an account’s equity falls below this threshold, the position gets forcibly closed at market price, triggering a liquidation event.
These maps aggregate data from major cryptocurrency derivatives exchanges, showing accumulated long and short liquidations across different price points. The visualization reveals psychological resistance and support levels where substantial trader capital faces elimination. Understanding these zones helps traders recognize where price pressure builds and where sudden reversals might occur.
The importance of liquidation maps has grown significantly as leverage usage increased across crypto markets. shorting bitcoin through derivatives amplified the significance of liquidation cascades, since concentrated short liquidations can spark explosive upside moves.
How Liquidation Levels Form
Liquidation levels emerge through mathematical mechanics inherent to leveraged trading. When a trader opens a 5x leveraged long position at $45,000, they effectively control five bitcoin for every bitcoin they deposit as collateral. The exchange calculates their liquidation price—the level where remaining collateral equals zero—typically around $36,000 (accounting for maintenance margins and fees).
As thousands of traders place similar leveraged bets, liquidation prices cluster within specific ranges. Major price support areas often coincide with where substantial liquidation liquidity exists, creating self-reinforcing patterns. When price approaches these zones, traders feel increasing pressure, potentially leading to panic selling or buying depending on position direction.
Several factors influence liquidation level formation:
- Entry price clustering: When major price moves occur, many traders enter positions at similar levels, creating concentrated liquidation zones
- Leverage amount: Higher leverage ratios create liquidation prices closer to entry points, increasing sensitivity to minor price movements
- Maintenance margin requirements: Different exchanges enforce different margin requirements, affecting where liquidations trigger
- Market sentiment: Bullish periods see more long liquidations clustered above current price; bearish periods show short liquidation concentration below
- Round-number psychology: Traders often set positions at psychological levels like $50,000 or $45,000, creating liquidation hotspots
Understanding DCA bitcoin strategy provides contrast to leveraged approaches, since dollar-cost averaging eliminates liquidation risk entirely by avoiding leverage altogether.

” alt=”Liquidation cascade visualization showing price levels with concentrated order clusters and market depth indicators”>
Reading and Interpreting Liquidation Data
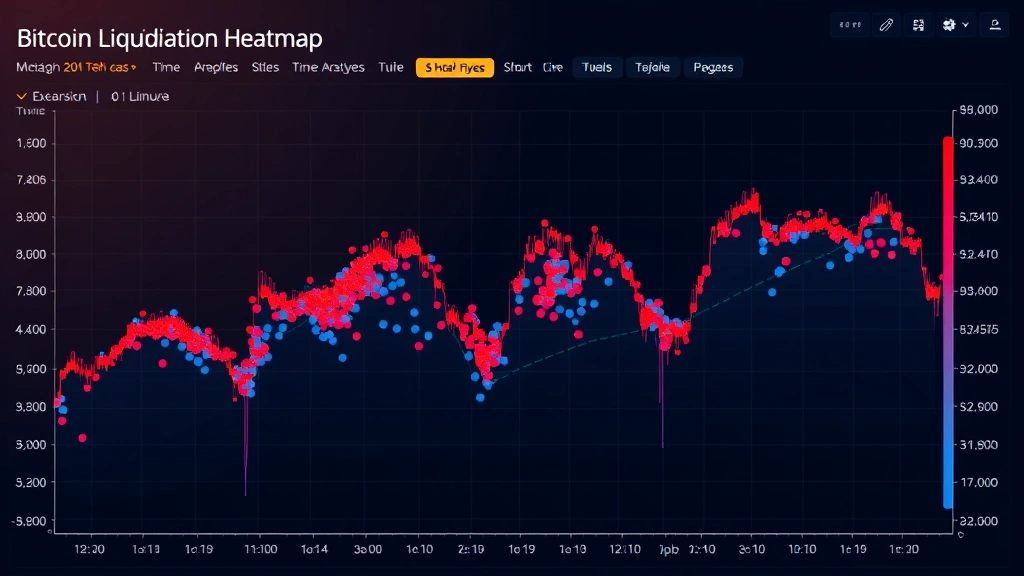
Effective liquidation map reading requires understanding several key metrics and visualization elements. Heat maps typically display price on the vertical axis and liquidation volume on the horizontal axis, with color intensity indicating concentration strength.
Long liquidations appear when bitcoin price rises and traders holding leveraged long positions face forced closures. These represent areas where upside moves encountered resistance due to trader capitulation. Short liquidations occur during downside moves when traders betting on price declines face elimination. Smart traders watch for liquidation walls—massive concentrations indicating potential volatility triggers.
Interpretation principles include:
- Identify major clusters: Scan for visually prominent liquidation concentrations that stand out from surrounding price levels
- Compare long versus short: Analyze the balance between bullish and bearish liquidations to gauge directional bias
- Monitor distance from current price: Liquidations closer to current price pose more immediate risk; distant liquidations represent longer-term support/resistance
- Assess historical validation: Check whether past liquidation clusters corresponded with actual price reversals or volatility spikes
- Track real-time changes: Liquidation maps update constantly; observing how clusters shift provides insights into evolving trader positioning
- Cross-reference multiple exchanges: Aggregated data from Binance, Bybit, and other major derivatives platforms provides more reliable signals
When examining liquidation intensity, consider that dense clusters represent more fragile market conditions. Prices moving toward high-liquidation zones often experience accelerating volatility as cascading liquidations trigger margin calls across multiple accounts simultaneously.
Using Liquidation Maps for Trading Strategy
Sophisticated traders incorporate liquidation map analysis into comprehensive trading strategies rather than relying solely on this tool. The liquidation landscape functions as one component within broader technical and fundamental analysis frameworks.
Breakout trading strategies leverage liquidation maps by identifying areas where substantial liquidation clusters exist above or below current price. When price approaches these zones, breakout traders anticipate accelerated movement as liquidations trigger. For instance, if short liquidations cluster heavily at $48,000 during a $45,000 price level, bullish traders might position for explosive upside as liquidations cascade.
Support and resistance identification becomes more nuanced when informed by liquidation data. Traditional chart support often coincides with liquidation clusters, since both represent price levels where buyers concentrate. Combining liquidation maps with price action analysis strengthens conviction in identified levels.
Risk management improves significantly when traders understand liquidation landscapes. Recognizing major liquidation clusters helps traders avoid positioning directly at these volatile zones where slippage and execution risk increase substantially. Understanding how many satoshis in a bitcoin matters less for liquidation strategy than understanding position sizing and leverage ratios.
Contrarian strategies also emerge from liquidation analysis. When extreme liquidation imbalances develop—such as massive long liquidation clusters with minimal short liquidations—contrarian traders recognize potential reversal setups. The market rarely liquidates positions in perfectly balanced fashion; imbalances create trading opportunities for disciplined traders.
Tools and Platforms for Tracking Liquidations
Multiple platforms provide real-time liquidation data and visualization tools. Understanding which tools offer reliable, comprehensive data proves essential for effective implementation.
CoinGlass remains the most popular liquidation tracking platform, offering real-time liquidation heatmaps across major exchanges. The platform displays liquidation cascades as they occur, helping traders monitor market stress conditions. CoinGlass aggregates data from Binance, Bybit, OKX, and other major derivatives exchanges, providing comprehensive coverage.
Liquidations.com specializes exclusively in liquidation tracking, offering simplified interfaces focused purely on liquidation data without additional trading features. This specialization appeals to traders wanting focused liquidation analysis without platform complexity.
Bybit’s native liquidation display shows real-time liquidations occurring on their exchange, though this represents only Bybit data rather than aggregated cross-exchange information. Exchange-specific data proves valuable when analyzing platform-specific market dynamics.
TradingView and similar charting platforms increasingly integrate liquidation overlays, allowing traders to view liquidation data alongside price charts. This integration streamlines analysis workflows by eliminating separate tool switching.
External resources like CoinDesk provide market context and analysis around major liquidation events, helping traders understand broader market implications beyond raw liquidation data.
” alt=”Bitcoin derivative market showing trader positions and liquidation cascade mechanics across multiple price levels”>
Risk Management Considerations
While liquidation maps provide valuable intelligence, traders must maintain realistic perspectives about their limitations and associated risks.
Liquidation maps show historical data with lag: Even real-time platforms experience slight delays between liquidation occurrence and display. This lag prevents traders from perfectly timing entries based on liquidation cascades. By the time liquidations appear on-screen, price movement often already occurred.
Liquidation cascades remain unpredictable: While liquidation maps identify where liquidations cluster, predicting exact timing and severity remains extremely difficult. A liquidation cluster might remain untouched for weeks or trigger within minutes. Traders cannot reliably profit from liquidation prediction alone.
False breakouts exploit liquidation chasers: Sophisticated traders recognize that retail traders watch liquidation maps. Manipulative price action sometimes deliberately triggers liquidations before reversing, exploiting traders betting on cascades.
Leverage amplifies liquidation risk: Ironically, traders using leverage to exploit liquidation maps increase their own liquidation exposure. This creates dangerous feedback loops where attempted profit-taking from liquidations triggers personal liquidations.
Platform risk varies: Different exchanges maintain different liquidation mechanics, margin requirements, and execution speeds. A liquidation cascade on one platform might not replicate on another, limiting strategy transferability.
Understanding pros and cons of cryptocurrency includes recognizing that leverage and liquidation risk represent substantial downsides to crypto trading compared to traditional assets. Conservative traders often avoid leverage entirely, eliminating liquidation exposure while sacrificing upside amplification.
Market Psychology Behind Liquidations
The psychological dimensions of liquidation markets often surpass the mathematical mechanics in importance. Understanding trader psychology illuminates why liquidation maps matter for market prediction.
Fear and panic intensify cascades: As price approaches liquidation zones, traders holding margined positions experience mounting anxiety. This psychological pressure often causes panic selling or buying before actual liquidations occur, pre-emptively moving price toward liquidation clusters. The anticipation of liquidations sometimes matters more than liquidations themselves.
Liquidation clustering creates self-fulfilling prophecies: When traders recognize massive liquidation concentrations, they position for cascades. This positioning itself moves price toward liquidation zones, potentially triggering cascades that would not have occurred organically. The map influences the outcome it merely maps.
Survivor bias affects strategy perception: Traders remembering successful liquidation-based trades outnumber those remembering losses, creating psychological bias favoring liquidation strategies. Survivorship bias distorts perceived liquidation strategy profitability.
Emotional trading around liquidations: Watching liquidations occur in real-time triggers emotional responses—excitement, fear, regret—that cloud judgment. Successful traders often ignore liquidation displays during active trading, analyzing maps only during calm market conditions when emotions run cooler.
Research from Blockchain.com and similar analytics platforms documents how liquidation events correlate with increased retail investor losses, supporting the psychological interpretation that liquidations represent trader capitulation driven by emotional decision-making.
The relationship between capital gain realization and liquidation events remains underexplored but significant. Liquidated traders face forced capital losses, creating tax implications and psychological regret that influences subsequent trading behavior.
FAQ
What does a bitcoin liquidation map show?
A liquidation map visualizes price levels where concentrated trader liquidations cluster, indicating areas of market stress and potential volatility. The maps display both long and short liquidation positions, helping traders identify support, resistance, and potential cascade points.
How accurate are liquidation predictions?
Liquidation maps show where liquidations exist, not whether they will trigger. Predicting cascade timing and severity remains unreliable despite map data. Maps function as risk assessment tools rather than reliable prediction mechanisms.
Can I profit from liquidation map analysis?
Some traders profit from liquidation analysis combined with other technical tools, but liquidation maps alone rarely generate consistent profits. Successful implementation requires disciplined risk management and realistic expectations about limitations.
Which exchanges show the largest liquidations?
Binance, Bybit, and OKX represent the largest derivatives exchanges by volume, typically hosting the largest liquidation events. Platform-specific liquidation data differs due to varying leverage limits and margin requirements.
How often do liquidation maps update?
Professional platforms update liquidation maps continuously as events occur, with most displaying real-time or near-real-time data. However, slight delays between liquidation occurrence and display remain inevitable.
Should I use leverage if I understand liquidation maps?
Understanding liquidation mechanics does not eliminate leverage risk. Many experienced traders avoid leverage entirely, recognizing that liquidation knowledge cannot reliably predict cascade timing or prevent personal liquidations.


