How to Read a Bitcoin Order Book? Trader’s Guide
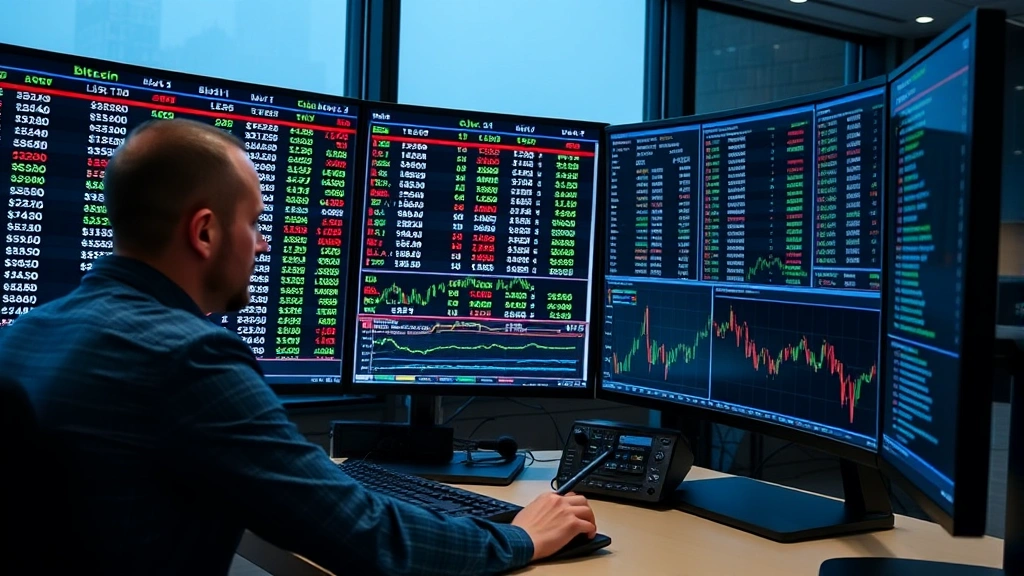
The bitcoin order book is one of the most critical tools for cryptocurrency traders, yet many beginners find it intimidating and confusing. Whether you’re executing a market trade, analyzing price movements, or trying to understand market sentiment, the order book provides real-time insights into supply and demand dynamics. Understanding how to read and interpret this data can dramatically improve your trading decisions and help you identify potential price movements before they happen.
An order book displays all pending buy and sell orders for bitcoin at various price levels on a cryptocurrency exchange. It’s essentially a live auction system where buyers and sellers express their willingness to transact at specific prices. The difference between the highest bid price and the lowest ask price—known as the spread—reveals market liquidity and trader sentiment. Learning to decode this information transforms you from a passive trader into someone who can make informed decisions based on actual market structure.
What is a Bitcoin Order Book
A bitcoin order book is a digital ledger maintained by cryptocurrency exchanges that lists all outstanding buy orders (bids) and sell orders (asks) for bitcoin at different price levels. Every major exchange—whether centralized platforms like Coinbase or decentralized exchanges—maintains an order book. When you place an order to buy or sell bitcoin, it gets added to this book and remains there until executed, cancelled, or expired.
The order book is divided into two sides: the left side shows buy orders (bids), and the right side shows sell orders (asks). Each entry includes the price level and the total quantity of bitcoin available at that price. For example, if there’s a bid at $42,500 for 2.5 BTC, it means a trader is willing to purchase 2.5 bitcoin at that exact price. This public information is essential for understanding what is cryptocurrency trading dynamics and how markets actually function.
The bitcoin order book updates in real-time, sometimes multiple times per second during high-volume periods. This constant flow of information reflects changing market conditions, breaking news, regulatory announcements, and trader sentiment shifts. Professional traders monitor order books across multiple exchanges simultaneously to identify arbitrage opportunities and predict short-term price movements.
Understanding Bids and Asks
The foundation of reading any order book is understanding the difference between bids and asks. A bid is a buy order—the price and quantity at which someone is willing to purchase bitcoin. An ask is a sell order—the price and quantity at which someone is willing to sell bitcoin. The highest bid price and the lowest ask price are called the best bid and best ask respectively.
The gap between the best bid and best ask is the bid-ask spread. If bitcoin’s best bid is $42,495 and the best ask is $42,505, the spread is $10. This spread represents the immediate cost of executing a market order—you’ll pay the ask price if buying or receive the bid price if selling. Tighter spreads indicate more liquidity and lower trading costs, while wider spreads suggest less liquidity and higher transaction friction.
When you place a limit order on the bid side (below the current price), you’re waiting for the price to fall to your level. When you place a limit order on the ask side (above the current price), you’re waiting for the price to rise. Market orders, by contrast, execute immediately at the current best bid or ask, filling whatever orders are available at those price levels. Understanding this distinction is crucial when you’re considering should I buy bitcoin now and at what price.
Volume at each price level matters significantly. If there’s 50 BTC available at the best ask versus only 2 BTC, large buyers will need to move up to higher price levels to complete their purchases. This creates predictable price movements that experienced traders anticipate and exploit.
Reading Depth Charts
A depth chart, also called a DOM (Depth of Market) chart, is a visual representation of the order book. The horizontal axis shows price levels, and the vertical axis shows cumulative volume. Two curves—typically red for asks and green for bids—form a shape that reveals market structure at a glance.
A steep depth curve indicates concentrated liquidity at specific price levels. Conversely, a gradual slope shows liquidity spread across many price levels. When the bid side has substantial volume below the current price, it suggests strong support—buyers are actively defending that price level. When the ask side has substantial volume above the current price, it indicates resistance.
The shape of the depth chart changes throughout the day. During high-volatility periods, you’ll notice the curve becomes steeper as traders cluster orders closer to the current price. During quiet periods, the curve flattens as orders spread across wider price ranges. Recognizing these patterns helps you understand whether the market is trending or consolidating.
Many exchanges display the order book in stacked format, showing cumulative volume. This makes it easy to see how much bitcoin would need to be purchased to move the price to a specific level. If you need to buy 10 BTC and there’s only 2 BTC at the current ask, you’ll absorb that 2 BTC and need to move to the next price level for the remaining 8 BTC.
Identifying Market Liquidity
Liquidity is the ability to buy or sell bitcoin quickly without significantly affecting its price. A highly liquid bitcoin order book has many orders at many different price levels. An illiquid order book has sparse orders concentrated in a few price levels. For traders, liquidity is everything—it determines whether you can execute your trades efficiently.
You can assess liquidity by examining the bid-ask spread and the volume at each level. Bitcoin on major exchanges like Kraken or Coinbase typically has tight spreads (often just cents), indicating excellent liquidity. Bitcoin trading pairs on smaller exchanges might have spreads of dollars, indicating lower liquidity and higher trading costs.
The order book also reveals wall formations—large orders placed at specific price levels to create the appearance of support or resistance. A “buy wall” is a massive bid order that prevents prices from falling below that level. A “sell wall” is a massive ask order that prevents prices from rising above that level. Experienced traders sometimes place these walls to influence price action, though this practice is controversial and potentially illegal in some jurisdictions.
Pay attention to how quickly orders are executed. During periods of high volume, orders disappear and reappear constantly. During quiet periods, orders sit unchanged for minutes or hours. This execution velocity tells you whether market participants are anxious (high velocity, wide spreads) or patient (low velocity, tight spreads).
Spotting Trading Patterns
Experienced order book readers can identify predictable patterns that precede price movements. One common pattern is the iceberg order, where a large trader divides their order into smaller visible portions to avoid revealing their full intention. If you see orders consistently appearing and disappearing at the same price level in regular intervals, you might be observing an iceberg order.
Another pattern is layering or spoofing, where traders place multiple orders at different levels to create the illusion of support or resistance. These orders often disappear before execution when the price reaches them. While technically illegal under market manipulation laws in most jurisdictions, it still occurs and savvy traders learn to recognize it.
Watch for market maker activity. Market makers place both buy and sell orders simultaneously, profiting from the spread. When you see consistently balanced orders on both sides of the book at tight spreads, market makers are active. When market makers withdraw liquidity (orders disappear), volatility typically increases.
Price breakout patterns often show in the order book before they show on price charts. If the ask side suddenly has far more volume than the bid side, buyers are withdrawing. This often precedes a price decline. Conversely, if the bid side suddenly accumulates volume, it often precedes a price increase. These shifts happen seconds or minutes before they appear on candlestick charts.
Advanced Order Book Strategies
Professional traders use order book analysis to implement sophisticated strategies. Scalping relies on reading the order book to identify small price movements within seconds or minutes. A scalper might notice that the ask side has weak volume and place a market buy order, knowing the price will spike as they absorb the available liquidity. They then immediately place a sell order at the higher price.
Order book painting involves placing large orders to signal your intentions to other traders. You might place a large buy order to signal bullish sentiment, hoping others follow and push the price up. You can then cancel the order and profit from the price movement you created. This is technically manipulation but requires sophisticated understanding of market psychology.
Arbitrage trading uses the order book to identify price discrepancies across exchanges. Bitcoin might trade at $42,500 on one exchange and $42,510 on another. An arbitrageur buys on the cheaper exchange and sells on the expensive one, profiting from the difference. This requires real-time order book monitoring across multiple platforms and fast execution.
Understanding order book dynamics also helps when considering long-term decisions like evaluating bitcoin mining profitability. Miners need to understand whether buy pressure from institutions (visible in order book accumulation) justifies the energy costs of mining operations.
The order book also reveals what is a bear market vs bull market sentiment. During bear markets, the bid side typically shows larger volumes as traders position for further declines. During bull markets, the ask side shows larger volumes as traders take profits.
Common Pitfalls and Risks
Many traders make critical mistakes when reading order books. The first mistake is over-relying on static snapshots. The order book changes constantly. An order book screenshot might show large support at $42,000, but by the time the price falls there, that support has vanished. Always remember that order books are dynamic, and orders can be cancelled instantly.
Another common error is misinterpreting walls. A large order might indicate genuine intent, or it might be a spoofing attempt designed to disappear when the price approaches. Experienced traders look for patterns—walls that repeatedly appear and disappear at the same level are likely spoofs. Walls that get partially filled and reappear are likely genuine.
Traders often ignore order execution velocity. A large bid order that sits for hours is different from one that appeared seconds ago. The former suggests the trader is patient and confident in their price. The latter might indicate a temporary positioning. The timing of orders matters as much as their size.
Many traders fail to account for exchange differences. Each exchange has its own order book, and liquidity varies significantly. Bitcoin on Kraken or Binance has different order book structures. Strategies that work on highly liquid exchanges might fail on smaller platforms with sparse order books.
Confirmation bias is another risk. If you expect the price to rise, you might interpret order book data as bullish when it’s actually neutral or bearish. Always challenge your interpretation and look for contradictory signals. The order book tells the truth about current supply and demand, regardless of your market bias.
Finally, traders often underestimate the role of external news. The order book might show strong support, but a regulatory announcement can destroy that support in milliseconds. Order book analysis is most reliable when combined with broader market analysis and awareness of potential catalysts. Consider checking CoinDesk for the latest bitcoin news while monitoring order book changes.
Understanding how many satoshis in a bitcoin is also important for order book analysis, as some traders work with satoshi-level precision when analyzing order flow and volume patterns.
FAQ
What’s the difference between limit orders and market orders in the order book?
Limit orders specify a maximum price you’ll pay (for buys) or minimum price you’ll accept (for sells). They sit in the order book until executed or cancelled. Market orders execute immediately at the current best bid or ask, and they don’t appear in the order book—they consume existing liquidity instead.
How can I detect fake orders or spoofing in the order book?
Look for patterns where orders consistently appear and disappear without execution, especially at round numbers or at specific price levels. Watch order book videos or use exchange tools to see orders in real-time. Genuine orders typically show some execution, while spoofed orders vanish before the price reaches them. However, detection is challenging and requires experience.
Does the order book predict bitcoin price movements?
The order book provides valuable information about current supply and demand, but it cannot predict future prices with certainty. It shows what traders are willing to do right now, but sentiment can shift instantly. Use order book analysis alongside technical analysis, fundamental analysis, and market news for better predictions.
Which bitcoin exchanges have the most reliable order books?
Major exchanges like Coinbase, Kraken, Binance, and Gemini have deep, liquid order books with tight spreads. These platforms have robust trading infrastructure and are heavily regulated. Smaller exchanges might have sparser order books and wider spreads, making them less suitable for active trading.
Can beginners profit from order book analysis?
Beginners can learn valuable lessons from order book analysis, but profitable trading requires significant practice and experience. Start by watching order books during different market conditions and observing patterns. Paper trading (simulated trading without real money) is an excellent way to develop skills before risking real capital.
How often should I check the order book?
This depends on your trading strategy. Day traders and scalpers might monitor it constantly, while swing traders check it several times daily. Long-term investors might check it occasionally to understand market sentiment. The more frequently you trade, the more attention you should pay to order book dynamics.


