XRP’s Golden Cross: What It Means for Bitcoin?
The cryptocurrency market operates on technical patterns that traders and analysts closely monitor to predict price movements. One of the most significant technical indicators is the golden cross, a bullish signal that occurs when a shorter-term moving average crosses above a longer-term moving average. Recently, XRP (Ripple) has formed a golden cross on its price chart, sparking widespread discussion about what this development means not only for XRP itself but also for the broader cryptocurrency ecosystem, particularly Bitcoin.
When major altcoins like XRP display strong technical signals, the implications often ripple through the entire market. Bitcoin, as the leading cryptocurrency by market capitalization, frequently moves in correlation with altcoin performance, though the relationship is complex and multifaceted. Understanding XRP’s golden cross and its potential impact on Bitcoin requires a deep dive into technical analysis, market dynamics, and the interconnected nature of cryptocurrency markets.
This comprehensive guide explores the significance of XRP’s golden cross, examines how altcoin movements influence Bitcoin, and provides insights into what investors should consider when interpreting these technical signals.
Understanding the Golden Cross in Cryptocurrency
The golden cross is a technical indicator that has been used in traditional financial markets for decades and has become increasingly important in cryptocurrency analysis. This pattern occurs when the 50-day moving average (MA) crosses above the 200-day moving average on a price chart. The crossover represents a shift from bearish to bullish momentum, signaling that shorter-term price trends have turned positive relative to longer-term trends.
In cryptocurrency markets, the golden cross carries significant weight because it suggests that recent price action has overcome longer-term resistance and selling pressure. When XRP experiences a golden cross, it indicates that buyers have gained control of the market in the medium term, pushing prices higher than the average price over the past 200 days. This technical setup often attracts institutional investors and algorithmic traders who use moving averages as key decision points.
The inverse of the golden cross is the death cross, where the 50-day MA falls below the 200-day MA, signaling a bearish reversal. Traders use both signals to time entries and exits in their positions. The reliability of the golden cross depends on several factors, including trading volume, market conditions, and broader macroeconomic factors affecting cryptocurrency valuations.
When analyzing a golden cross, traders examine the angle of the crossover, the distance between the moving averages, and confirmation from other technical indicators like the Relative Strength Index (RSI) or Moving Average Convergence Divergence (MACD). A steep crossover with strong volume typically carries more weight than a shallow, low-volume crossover.
XRP’s Recent Golden Cross Formation
XRP, the native token of the Ripple blockchain network, recently formed a golden cross that has captured the attention of technical analysts and cryptocurrency investors worldwide. This development comes at a critical time for Ripple, which has faced regulatory challenges and market uncertainty over the past several years. The golden cross formation suggests that XRP may be entering a new phase of price appreciation and market confidence.
The timing of XRP’s golden cross is particularly significant given the broader cryptocurrency market environment. When major altcoins experience positive technical signals simultaneously, it often indicates a shift in market sentiment from risk-off to risk-on positioning. This shift can have cascading effects throughout the cryptocurrency ecosystem, starting with altcoins and potentially spreading to Bitcoin and other major assets.
XRP’s technical setup includes not only the golden cross but also other bullish indicators such as increasing trading volume, positive divergences on weekly charts, and breakouts above key resistance levels. These confluences of technical factors strengthen the signal and suggest that the move may be more sustainable than isolated golden crosses that lack supporting evidence.
However, it’s important to note that past performance of technical indicators in cryptocurrency is not guaranteed to predict future results. The crypto market is highly speculative, influenced by regulatory news, macroeconomic factors, and sentiment shifts that can quickly reverse technical patterns. When considering how to read cryptocurrency charts, investors should use multiple indicators and maintain a balanced perspective.

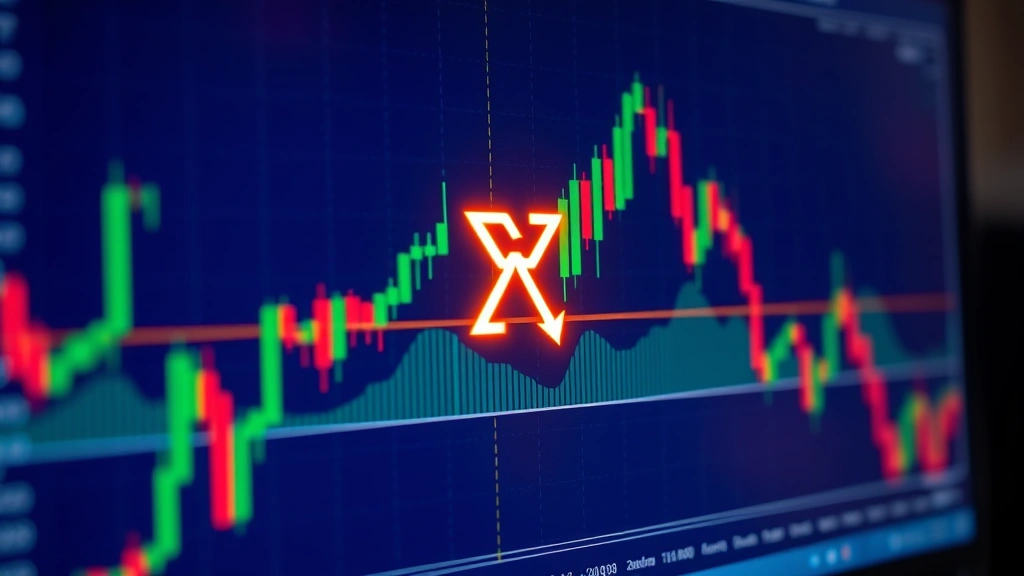
” alt=”Golden cross pattern visualization on XRP cryptocurrency chart showing 50-day and 200-day moving averages intersection with increasing trading volume” style=”max-width:100%;height:auto;border-radius:8px;”>
How Altcoin Signals Influence Bitcoin
The relationship between altcoins and Bitcoin is complex and has evolved significantly since the early days of cryptocurrency. Historically, Bitcoin dominated the market, and altcoins followed Bitcoin’s price movements with little independent influence. However, as the cryptocurrency market has matured and diversified, altcoins have gained more independence and can sometimes lead price movements that eventually affect Bitcoin.
When XRP forms a golden cross and experiences strong price appreciation, it can signal several things to Bitcoin investors. First, it may indicate that risk appetite is returning to the cryptocurrency market more broadly. If investors are willing to allocate capital to altcoins, they may also be prepared to increase their Bitcoin positions. Second, strong altcoin performance can reduce the dominance ratio—the percentage of total cryptocurrency market cap held by Bitcoin—which sometimes coincides with Bitcoin price increases as capital flows into the broader ecosystem.
The mechanism by which altcoin signals influence Bitcoin operates through several channels. Trading pairs on cryptocurrency exchanges often pit altcoins directly against Bitcoin. When XRP strengthens against Bitcoin (measured in BTC/XRP trading pairs), it suggests that traders are favoring XRP temporarily, which can create a temporary drag on Bitcoin prices. However, this effect is usually short-term and often gives way to broader market trends.
Additionally, positive technical signals in major altcoins can attract capital that might otherwise flow to Bitcoin. When investors see strong technical setups in XRP, Ethereum, or other large-cap altcoins, they may diversify their cryptocurrency holdings away from Bitcoin temporarily. This capital reallocation can affect Bitcoin’s price momentum, though the magnitude of the effect depends on the size of the capital flows involved.
Understanding why Bitcoin goes up requires examining not just Bitcoin-specific factors but also the broader market environment created by altcoin performance and investor sentiment across the entire cryptocurrency ecosystem.
Market Correlation and Cryptocurrency Dynamics
Cryptocurrency market correlation refers to how different digital assets move in relation to one another. Bitcoin typically maintains a positive correlation with most altcoins, meaning they tend to rise and fall together. However, this correlation is not perfect and varies depending on market conditions, regulatory developments, and individual project news.
During bull markets, correlation between Bitcoin and altcoins tends to increase, as rising tide lifts all boats. Investors gain confidence in the broader cryptocurrency space and allocate capital across multiple assets. During bear markets, correlation also tends to increase, but in the downward direction, as fear-driven selling affects the entire market. The most interesting dynamics occur during transitional periods when correlations can diverge significantly.
XRP’s golden cross occurs in a market environment where Bitcoin correlation with altcoins remains relatively high but not absolute. This means that while XRP’s technical signal is positive, it doesn’t guarantee similar movements in Bitcoin. However, if XRP’s gains attract new capital into cryptocurrency and inspire confidence in other altcoins, the positive sentiment could eventually benefit Bitcoin through increased overall market participation.
The concept of “alt season” is directly related to market correlation dynamics. Alt season occurs when altcoins significantly outperform Bitcoin, suggesting that correlation has decreased and capital is flowing preferentially into altcoins. XRP’s golden cross could be an early indicator of potential alt season development, though such seasons are notoriously difficult to predict and can reverse quickly.
When considering whether to buy Bitcoin now, investors should evaluate not just Bitcoin’s technical picture but also the broader altcoin market environment and correlation dynamics that may influence capital flows into or out of Bitcoin.
Technical Analysis Best Practices for Crypto Investors
Using technical analysis effectively in cryptocurrency markets requires discipline, proper methodology, and realistic expectations about what technical indicators can and cannot accomplish. The golden cross is a useful tool, but it should never be the sole basis for investment decisions.
Best practices for technical analysis in cryptocurrency include:
- Multiple timeframe analysis: Examine the golden cross on daily, weekly, and monthly charts to understand whether the signal is confirmed across different timeframes. A golden cross on the daily chart is less significant if the weekly and monthly charts show bearish patterns.
- Volume confirmation: Verify that price movements accompanying the golden cross occur with above-average trading volume. High volume suggests conviction among traders, while low volume suggests the move may lack staying power.
- Support and resistance levels: Analyze whether the golden cross occurs near significant support or resistance levels. A golden cross that pushes price through a major resistance level is more significant than one that occurs in the middle of a trading range.
- Confluence of indicators: Use multiple technical indicators to confirm the golden cross signal. MACD, RSI, Stochastic oscillators, and Bollinger Bands can provide additional confirmation or warnings about the reliability of the signal.
- Risk management: Establish clear stop-loss levels based on technical analysis. If the price falls below the moving averages that formed the golden cross, the signal has been invalidated and positions should be exited.
- Context awareness: Consider the broader market context, including macroeconomic factors, regulatory developments, and cryptocurrency-specific news that might influence technical patterns.
Learning how to read cryptocurrency charts properly takes time and practice. New investors should paper trade (simulate trading without real money) before risking capital based on technical signals.
” alt=”Cryptocurrency market dashboard showing multiple technical indicators including moving averages, RSI, and MACD on Bitcoin and altcoin price charts” style=”max-width:100%;height:auto;border-radius:8px;”>
Risk Considerations and Portfolio Management
While XRP’s golden cross presents an interesting technical opportunity, investors must carefully consider the risks involved in trading or investing based on technical signals. Cryptocurrency markets remain highly volatile and speculative, and technical patterns can fail without warning.
Key risk considerations include:
Regulatory Risk: XRP has faced significant regulatory scrutiny due to questions about whether it should be classified as a security. Changes in regulatory treatment can quickly invalidate technical signals. Investors should monitor regulatory developments closely, as they can cause rapid price reversals regardless of technical patterns.
Market Manipulation Risk: Cryptocurrency markets, particularly for altcoins like XRP, can be subject to manipulation by large holders (whales) or coordinated trading groups. A golden cross could theoretically be manufactured to trigger stop-losses or encourage retail investors to buy before a coordinated sell-off.
Liquidity Risk: While XRP has good liquidity on major exchanges, market conditions can change rapidly. During periods of market stress, liquidity can evaporate, making it difficult to execute trades at expected prices.
Correlation Risk: If Bitcoin experiences a sharp decline, the positive effects of XRP’s golden cross could be overwhelmed by broader market selling pressure. The correlation between Bitcoin and altcoins tends to increase during market crashes.
To manage these risks effectively, investors should diversify their investment portfolio and avoid concentrating too much capital in any single asset or technical signal. Position sizing should reflect the speculative nature of cryptocurrency trading and individual risk tolerance levels.
Future Outlook for XRP and Bitcoin
The future trajectory of XRP and its relationship to Bitcoin will depend on multiple factors extending far beyond technical analysis. Regulatory clarity, adoption developments, macroeconomic conditions, and broader cryptocurrency market sentiment will all play important roles.
For XRP specifically, the resolution of regulatory issues could be transformative. Clarity on whether XRP is a security or commodity would remove significant uncertainty and potentially unlock institutional investment. Ripple’s continued development of payment solutions and partnerships with financial institutions could strengthen XRP’s fundamental value proposition.
For Bitcoin, the outlook depends on factors including macroeconomic conditions, institutional adoption trends, regulatory developments, and the resolution of technical resistance levels. Current Bitcoin price today levels provide context for understanding potential price targets and support levels that traders monitor.
The relationship between XRP and Bitcoin may evolve as both assets mature. Increased institutional participation could lead to more rational pricing based on fundamental factors rather than technical patterns alone. Alternatively, retail-driven trading could continue to dominate, maintaining the importance of technical analysis.
Investors should maintain flexibility in their outlook and be prepared to adjust positions as new information becomes available. Technical signals like the golden cross provide useful frameworks for thinking about market dynamics, but they should always be combined with fundamental analysis, risk management, and realistic expectations about market behavior.
FAQ
What exactly is a golden cross in cryptocurrency?
A golden cross occurs when the 50-day moving average crosses above the 200-day moving average on a price chart. This technical pattern is considered a bullish signal suggesting that short-term price trends have turned positive relative to longer-term trends. In cryptocurrency markets, traders use this signal to identify potential buying opportunities and shifts in market momentum.
Does XRP’s golden cross guarantee Bitcoin will rise?
No, XRP’s golden cross does not guarantee Bitcoin will rise. While positive technical signals in major altcoins can contribute to broader market sentiment and potentially influence capital flows into cryptocurrency, Bitcoin’s price is determined by many factors including regulatory developments, macroeconomic conditions, technical resistance levels, and overall market sentiment. The golden cross is one tool among many that investors use to analyze markets.
How reliable are golden crosses in predicting cryptocurrency price movements?
Golden crosses have moderate reliability in predicting price movements, but they are far from perfect. Studies suggest that golden crosses are more reliable when accompanied by high trading volume, when they occur at significant support or resistance levels, and when they are confirmed by other technical indicators. However, cryptocurrency markets are highly speculative and can quickly reverse technical patterns based on news, regulation, or sentiment shifts.
Should I buy XRP or Bitcoin based on this golden cross?
Investment decisions should never be based solely on a single technical indicator like the golden cross. Instead, investors should conduct comprehensive analysis including technical analysis, fundamental evaluation of the project, risk assessment, and consideration of their personal financial situation and investment goals. Consulting with a financial advisor and conducting thorough due diligence is recommended before making investment decisions.
How does XRP’s performance affect Bitcoin’s price?
XRP’s performance can affect Bitcoin through several mechanisms: capital reallocation between assets, changes in overall market sentiment and risk appetite, shifts in the Bitcoin dominance ratio, and correlation dynamics. However, the effect is usually moderate and temporary, as Bitcoin’s price is primarily determined by its own technical levels, macroeconomic factors, and regulatory environment rather than altcoin performance alone.
What is the difference between a golden cross and a death cross?
A golden cross occurs when the 50-day moving average crosses above the 200-day moving average, signaling bullish momentum. A death cross is the opposite: when the 50-day moving average crosses below the 200-day moving average, signaling bearish momentum. Both patterns are used by traders as reversal signals, though neither is guaranteed to predict future price movements accurately.


